Exploring and visualizing results
explore_visualize_results.RmdrvatResult
The rvatResult() class is designed to work with results
from RVAT analyses, and extends the DataFrame class (see:
S4Vectors).
It supports all kinds of common operations such as subsetting and
merging, and several methods are defined for reading&writing and
(interactive) visualization.
Reading & Writing
The rvbResult() function loads a results file written to
disk (note that for single variant results there is an equivalent
singlevarResult()) function:`
library(rvat)
library(rvatData)
outdir <- tempdir()

# Load example results file
data(rvbresults)
head(rvbresults)
## rvbResult with 6 rows and 28 columns
## unit cohort varSetName name pheno covar geneticModel
## <character> <Rle> <Rle> <Rle> <Rle> <Rle> <Rle>
## 1 A1BG pheno ModerateImpact maf001 pheno PC1,PC2,PC3,PC4 allelic
## 2 A1BG pheno ModerateImpact maf001 pheno PC1,PC2,PC3,PC4 allelic
## 3 A1BG pheno ModerateImpact maf001 pheno PC1,PC2,PC3,PC4 allelic
## 4 A1BG pheno ModerateImpact maf001 pheno PC1,PC2,PC3,PC4 allelic
## 5 A1BG pheno HighImpact maf001 pheno PC1,PC2,PC3,PC4 allelic
## 6 A1BG pheno HighImpact maf001 pheno PC1,PC2,PC3,PC4 allelic
## MAFweight test nvar caseCarriers ctrlCarriers
## <Rle> <Rle> <numeric> <numeric> <numeric>
## 1 1 firth 74 87 333
## 2 1 skat_robust 74 87 333
## 3 1 acatvSPA 74 87 333
## 4 1 skat_burden_robust 74 87 333
## 5 1 firth 4 2 13
## 6 1 skat_robust 4 2 13
## meanCaseScore meanCtrlScore caseN ctrlN caseCallRate ctrlCallRate
## <numeric> <numeric> <numeric> <numeric> <numeric> <numeric>
## 1 0.017500262 0.01675191 5000 20000 0.993846 0.993780
## 2 0.017500262 0.01675191 5000 20000 0.993846 0.993780
## 3 0.017500262 0.01675191 5000 20000 0.993846 0.993780
## 4 0.017500262 0.01675191 5000 20000 0.993846 0.993780
## 5 0.000404543 0.00065511 5000 20000 0.995350 0.994775
## 6 0.000404543 0.00065511 5000 20000 0.995350 0.994775
## effect effectSE effectCIlower effectCIupper OR P
## <numeric> <numeric> <numeric> <numeric> <numeric> <numeric>
## 1 0.0541596 NA -0.189003 0.286712 1.055653 0.656635
## 2 NA NA NA NA NA 0.385580
## 3 NA NA NA NA NA 0.446330
## 4 NA NA NA NA NA 0.681784
## 5 -0.3175556 NA -1.945522 0.875390 0.727926 0.632891
## 6 NA NA NA NA NA 0.884041
## CHROM POS start end
## <numeric> <numeric> <numeric> <numeric>
## 1 19 58349335 58345178 58353492
## 2 19 58349335 58345178 58353492
## 3 19 58349335 58345178 58353492
## 4 19 58349335 58345178 58353492
## 5 19 58349335 58345178 58353492
## 6 19 58349335 58345178 58353492The writeResult() method writes the data to disk:
writeResult(rvbresults, file = paste0(outdir,"/burden_results.txt.gz"))The rvbResult() function can be used to load
results:
Inspecting the results
The summary() method gives a summary of the contents of
the results file:
summary(rvbresults)## rvbResult object
## -------------------
## n units = 18385
## N cases = 5000
## N controls = 20000
## names = maf001
## varSets = ModerateImpact; HighImpact
## tests = firth; skat_robust; acatvSPA; skat_burden_robust
## covars = PC1,PC2,PC3,PC4
## geneticModels = allelic
## MAFweights = 1
## pheno = pheno
## cohorts = phenoSeveral methods such as head(), dim(),
ncol() and nrow() can be used to inspect the
results object:
rvbresults[1:5,]## rvbResult with 5 rows and 28 columns
## unit cohort varSetName name pheno covar geneticModel
## <character> <Rle> <Rle> <Rle> <Rle> <Rle> <Rle>
## 1 A1BG pheno ModerateImpact maf001 pheno PC1,PC2,PC3,PC4 allelic
## 2 A1BG pheno ModerateImpact maf001 pheno PC1,PC2,PC3,PC4 allelic
## 3 A1BG pheno ModerateImpact maf001 pheno PC1,PC2,PC3,PC4 allelic
## 4 A1BG pheno ModerateImpact maf001 pheno PC1,PC2,PC3,PC4 allelic
## 5 A1BG pheno HighImpact maf001 pheno PC1,PC2,PC3,PC4 allelic
## MAFweight test nvar caseCarriers ctrlCarriers
## <Rle> <Rle> <numeric> <numeric> <numeric>
## 1 1 firth 74 87 333
## 2 1 skat_robust 74 87 333
## 3 1 acatvSPA 74 87 333
## 4 1 skat_burden_robust 74 87 333
## 5 1 firth 4 2 13
## meanCaseScore meanCtrlScore caseN ctrlN caseCallRate ctrlCallRate
## <numeric> <numeric> <numeric> <numeric> <numeric> <numeric>
## 1 0.017500262 0.01675191 5000 20000 0.993846 0.993780
## 2 0.017500262 0.01675191 5000 20000 0.993846 0.993780
## 3 0.017500262 0.01675191 5000 20000 0.993846 0.993780
## 4 0.017500262 0.01675191 5000 20000 0.993846 0.993780
## 5 0.000404543 0.00065511 5000 20000 0.995350 0.994775
## effect effectSE effectCIlower effectCIupper OR P
## <numeric> <numeric> <numeric> <numeric> <numeric> <numeric>
## 1 0.0541596 NA -0.189003 0.286712 1.055653 0.656635
## 2 NA NA NA NA NA 0.385580
## 3 NA NA NA NA NA 0.446330
## 4 NA NA NA NA NA 0.681784
## 5 -0.3175556 NA -1.945522 0.875390 0.727926 0.632891
## CHROM POS start end
## <integer> <numeric> <integer> <numeric>
## 1 19 58349335 58345178 58353492
## 2 19 58349335 58345178 58353492
## 3 19 58349335 58345178 58353492
## 4 19 58349335 58345178 58353492
## 5 19 58349335 58345178 58353492
dim(rvbresults)## [1] 139740 28
ncol(rvbresults)## [1] 28
head(rvbresults)## rvbResult with 6 rows and 28 columns
## unit cohort varSetName name pheno covar geneticModel
## <character> <Rle> <Rle> <Rle> <Rle> <Rle> <Rle>
## 1 A1BG pheno ModerateImpact maf001 pheno PC1,PC2,PC3,PC4 allelic
## 2 A1BG pheno ModerateImpact maf001 pheno PC1,PC2,PC3,PC4 allelic
## 3 A1BG pheno ModerateImpact maf001 pheno PC1,PC2,PC3,PC4 allelic
## 4 A1BG pheno ModerateImpact maf001 pheno PC1,PC2,PC3,PC4 allelic
## 5 A1BG pheno HighImpact maf001 pheno PC1,PC2,PC3,PC4 allelic
## 6 A1BG pheno HighImpact maf001 pheno PC1,PC2,PC3,PC4 allelic
## MAFweight test nvar caseCarriers ctrlCarriers
## <Rle> <Rle> <numeric> <numeric> <numeric>
## 1 1 firth 74 87 333
## 2 1 skat_robust 74 87 333
## 3 1 acatvSPA 74 87 333
## 4 1 skat_burden_robust 74 87 333
## 5 1 firth 4 2 13
## 6 1 skat_robust 4 2 13
## meanCaseScore meanCtrlScore caseN ctrlN caseCallRate ctrlCallRate
## <numeric> <numeric> <numeric> <numeric> <numeric> <numeric>
## 1 0.017500262 0.01675191 5000 20000 0.993846 0.993780
## 2 0.017500262 0.01675191 5000 20000 0.993846 0.993780
## 3 0.017500262 0.01675191 5000 20000 0.993846 0.993780
## 4 0.017500262 0.01675191 5000 20000 0.993846 0.993780
## 5 0.000404543 0.00065511 5000 20000 0.995350 0.994775
## 6 0.000404543 0.00065511 5000 20000 0.995350 0.994775
## effect effectSE effectCIlower effectCIupper OR P
## <numeric> <numeric> <numeric> <numeric> <numeric> <numeric>
## 1 0.0541596 NA -0.189003 0.286712 1.055653 0.656635
## 2 NA NA NA NA NA 0.385580
## 3 NA NA NA NA NA 0.446330
## 4 NA NA NA NA NA 0.681784
## 5 -0.3175556 NA -1.945522 0.875390 0.727926 0.632891
## 6 NA NA NA NA NA 0.884041
## CHROM POS start end
## <integer> <numeric> <integer> <numeric>
## 1 19 58349335 58345178 58353492
## 2 19 58349335 58345178 58353492
## 3 19 58349335 58345178 58353492
## 4 19 58349335 58345178 58353492
## 5 19 58349335 58345178 58353492
## 6 19 58349335 58345178 58353492subsetting is identical to data.frame:
rvbresults[rvbresults$varSetName == "ModerateImpact" & rvbresults$test == "firth", ]## rvbResult with 18385 rows and 28 columns
## unit cohort varSetName name pheno covar
## <character> <Rle> <Rle> <Rle> <Rle> <Rle>
## 1 A1BG pheno ModerateImpact maf001 pheno PC1,PC2,PC3,PC4
## 2 A1CF pheno ModerateImpact maf001 pheno PC1,PC2,PC3,PC4
## 3 A2M pheno ModerateImpact maf001 pheno PC1,PC2,PC3,PC4
## 4 A2ML1 pheno ModerateImpact maf001 pheno PC1,PC2,PC3,PC4
## 5 A3GALT2 pheno ModerateImpact maf001 pheno PC1,PC2,PC3,PC4
## ... ... ... ... ... ... ...
## 18381 ZYG11A pheno ModerateImpact maf001 pheno PC1,PC2,PC3,PC4
## 18382 ZYG11B pheno ModerateImpact maf001 pheno PC1,PC2,PC3,PC4
## 18383 ZYX pheno ModerateImpact maf001 pheno PC1,PC2,PC3,PC4
## 18384 ZZEF1 pheno ModerateImpact maf001 pheno PC1,PC2,PC3,PC4
## 18385 ZZZ3 pheno ModerateImpact maf001 pheno PC1,PC2,PC3,PC4
## geneticModel MAFweight test nvar caseCarriers ctrlCarriers
## <Rle> <Rle> <Rle> <numeric> <numeric> <numeric>
## 1 allelic 1 firth 74 87 333
## 2 allelic 1 firth 120 110 424
## 3 allelic 1 firth 85 91 359
## 4 allelic 1 firth 92 71 307
## 5 allelic 1 firth 77 108 435
## ... ... ... ... ... ... ...
## 18381 allelic 1 firth 96 76 328
## 18382 allelic 1 firth 140 103 484
## 18383 allelic 1 firth 76 71 242
## 18384 allelic 1 firth 119 111 446
## 18385 allelic 1 firth 147 138 570
## meanCaseScore meanCtrlScore caseN ctrlN caseCallRate ctrlCallRate
## <numeric> <numeric> <numeric> <numeric> <numeric> <numeric>
## 1 0.0175003 0.0167519 5000 20000 0.993846 0.993780
## 2 0.0225334 0.0218277 5000 20000 0.992203 0.992376
## 3 0.0185223 0.0181244 5000 20000 0.993259 0.993359
## 4 0.0147961 0.0159419 5000 20000 0.988600 0.988482
## 5 0.0223714 0.0228223 5000 20000 0.992039 0.991970
## ... ... ... ... ... ... ...
## 18381 0.0159353 0.0168750 5000 20000 0.990873 0.990993
## 18382 0.0211882 0.0247356 5000 20000 0.992383 0.992559
## 18383 0.0145031 0.0123996 5000 20000 0.993363 0.993451
## 18384 0.0225616 0.0228088 5000 20000 0.993282 0.993289
## 18385 0.0279523 0.0290055 5000 20000 0.992367 0.992253
## effect effectSE effectCIlower effectCIupper OR P
## <numeric> <numeric> <numeric> <numeric> <numeric> <numeric>
## 1 0.05415961 NA -0.189003 0.286712 1.055653 0.656635
## 2 0.03211086 NA -0.177584 0.233229 1.032632 0.759809
## 3 0.03168759 NA -0.203699 0.256917 1.032195 0.787796
## 4 -0.06278565 NA -0.319604 0.180203 0.939145 0.619415
## 5 -0.00977243 NA -0.216962 0.188369 0.990275 0.924538
## ... ... ... ... ... ... ...
## 18381 -0.04891597 NA -0.296667 0.1862110 0.952261 0.689294
## 18382 -0.15166089 NA -0.366766 0.0538411 0.859280 0.150367
## 18383 0.16056651 NA -0.104753 0.4130901 1.174176 0.230621
## 18384 -0.00785272 NA -0.218218 0.1939032 0.992178 0.940350
## 18385 -0.03779167 NA -0.227012 0.1444996 0.962914 0.688721
## CHROM POS start end
## <integer> <numeric> <integer> <numeric>
## 1 19 58349335 58345178 58353492
## 2 10 50842542 50799409 50885675
## 3 12 9091946 9067664 9116229
## 4 12 8854811 8822621 8887001
## 5 1 33313932 33306766 33321098
## ... ... ... ... ...
## 18381 1 52868754 52842511 52894998
## 18382 1 52776894 52726453 52827336
## 18383 7 143386203 143381295 143391111
## 18384 17 4073738 4004445 4143030
## 18385 1 77622918 77562416 77683419Combining, merging & splitting
Results files can be combined using rbind():
# for this example we'll split the results-file in two and then glue it back together:
results1 <- rvbresults[1:ceiling(nrow(rvbresults)/2), ]
results2 <- rvbresults[(ceiling(nrow(rvbresults)/2)+1):nrow(rvbresults), ]
test <- rbind(results1, results2)

# check if it's identical:
identical(rvbresults, test)
## [1] TRUEadd additional info to the results using merge(), where
the by parameter specifies which columns should be used to
join:
annotation <- as.data.frame(rvbresults)[,colnames(rvbresults) %in% c("unit", "CHROM","POS")]
annotation <- annotation[!duplicated(annotation$unit),]
rvbresults <- merge(rvbresults[,!colnames(rvbresults) %in% c("CHROM","POS")],
                 annotation,
                 by = "unit")
the split() method can be used to split a results object
into defined groups. The example below showcases how to split the
results into three result objects (returned in a list) based on the
varSetName column:
results_list <- S4Vectors::split(rvbresults, as.character(rvbresults$varSetName))
head(results_list[[1]])
## rvbResult with 6 rows and 28 columns
## unit cohort varSetName name pheno covar geneticModel
## <character> <Rle> <Rle> <Rle> <Rle> <Rle> <Rle>
## 1 A1BG pheno HighImpact maf001 pheno PC1,PC2,PC3,PC4 allelic
## 2 A1BG pheno HighImpact maf001 pheno PC1,PC2,PC3,PC4 allelic
## 3 A1BG pheno HighImpact maf001 pheno PC1,PC2,PC3,PC4 allelic
## 4 A1BG pheno HighImpact maf001 pheno PC1,PC2,PC3,PC4 allelic
## 5 A1CF pheno HighImpact maf001 pheno PC1,PC2,PC3,PC4 allelic
## 6 A1CF pheno HighImpact maf001 pheno PC1,PC2,PC3,PC4 allelic
## MAFweight test nvar caseCarriers ctrlCarriers
## <Rle> <Rle> <numeric> <numeric> <numeric>
## 1 1 firth 4 2 13
## 2 1 skat_robust 4 2 13
## 3 1 acatvSPA 4 2 13
## 4 1 skat_burden_robust 4 2 13
## 5 1 firth 7 2 22
## 6 1 skat_robust 7 2 22
## meanCaseScore meanCtrlScore caseN ctrlN caseCallRate ctrlCallRate
## <numeric> <numeric> <numeric> <numeric> <numeric> <numeric>
## 1 0.000404543 0.00065511 5000 20000 0.995350 0.994775
## 2 0.000404543 0.00065511 5000 20000 0.995350 0.994775
## 3 0.000404543 0.00065511 5000 20000 0.995350 0.994775
## 4 0.000404543 0.00065511 5000 20000 0.995350 0.994775
## 5 0.000403128 0.00110311 5000 20000 0.997171 0.997314
## 6 0.000403128 0.00110311 5000 20000 0.997171 0.997314
## effect effectSE effectCIlower effectCIupper OR P start
## <numeric> <numeric> <numeric> <numeric> <numeric> <numeric> <integer>
## 1 -0.317556 NA -1.94552 0.875390 0.727926 0.632891 58345178
## 2 NA NA NA NA NA 0.884041 58345178
## 3 NA NA NA NA NA 0.503607 58345178
## 4 NA NA NA NA NA 0.503878 58345178
## 5 -0.811025 NA -2.41136 0.316797 0.444402 0.175767 50799409
## 6 NA NA NA NA NA 0.590569 50799409
## end CHROM POS
## <numeric> <integer> <numeric>
## 1 58353492 19 58349335
## 2 58353492 19 58349335
## 3 58353492 19 58349335
## 4 58353492 19 58349335
## 5 50885675 10 50842542
## 6 50885675 10 50842542
head(results_list[[2]])## rvbResult with 6 rows and 28 columns
## unit cohort varSetName name pheno covar geneticModel
## <character> <Rle> <Rle> <Rle> <Rle> <Rle> <Rle>
## 1 A1BG pheno ModerateImpact maf001 pheno PC1,PC2,PC3,PC4 allelic
## 2 A1BG pheno ModerateImpact maf001 pheno PC1,PC2,PC3,PC4 allelic
## 3 A1BG pheno ModerateImpact maf001 pheno PC1,PC2,PC3,PC4 allelic
## 4 A1BG pheno ModerateImpact maf001 pheno PC1,PC2,PC3,PC4 allelic
## 5 A1CF pheno ModerateImpact maf001 pheno PC1,PC2,PC3,PC4 allelic
## 6 A1CF pheno ModerateImpact maf001 pheno PC1,PC2,PC3,PC4 allelic
## MAFweight test nvar caseCarriers ctrlCarriers
## <Rle> <Rle> <numeric> <numeric> <numeric>
## 1 1 firth 74 87 333
## 2 1 skat_robust 74 87 333
## 3 1 acatvSPA 74 87 333
## 4 1 skat_burden_robust 74 87 333
## 5 1 firth 120 110 424
## 6 1 skat_robust 120 110 424
## meanCaseScore meanCtrlScore caseN ctrlN caseCallRate ctrlCallRate
## <numeric> <numeric> <numeric> <numeric> <numeric> <numeric>
## 1 0.0175003 0.0167519 5000 20000 0.993846 0.993780
## 2 0.0175003 0.0167519 5000 20000 0.993846 0.993780
## 3 0.0175003 0.0167519 5000 20000 0.993846 0.993780
## 4 0.0175003 0.0167519 5000 20000 0.993846 0.993780
## 5 0.0225334 0.0218277 5000 20000 0.992203 0.992376
## 6 0.0225334 0.0218277 5000 20000 0.992203 0.992376
## effect effectSE effectCIlower effectCIupper OR P start
## <numeric> <numeric> <numeric> <numeric> <numeric> <numeric> <integer>
## 1 0.0541596 NA -0.189003 0.286712 1.05565 0.656635 58345178
## 2 NA NA NA NA NA 0.385580 58345178
## 3 NA NA NA NA NA 0.446330 58345178
## 4 NA NA NA NA NA 0.681784 58345178
## 5 0.0321109 NA -0.177584 0.233229 1.03263 0.759809 50799409
## 6 NA NA NA NA NA 0.990635 50799409
## end CHROM POS
## <numeric> <integer> <numeric>
## 1 58353492 19 58349335
## 2 58353492 19 58349335
## 3 58353492 19 58349335
## 4 58353492 19 58349335
## 5 50885675 10 50842542
## 6 50885675 10 50842542Visualize
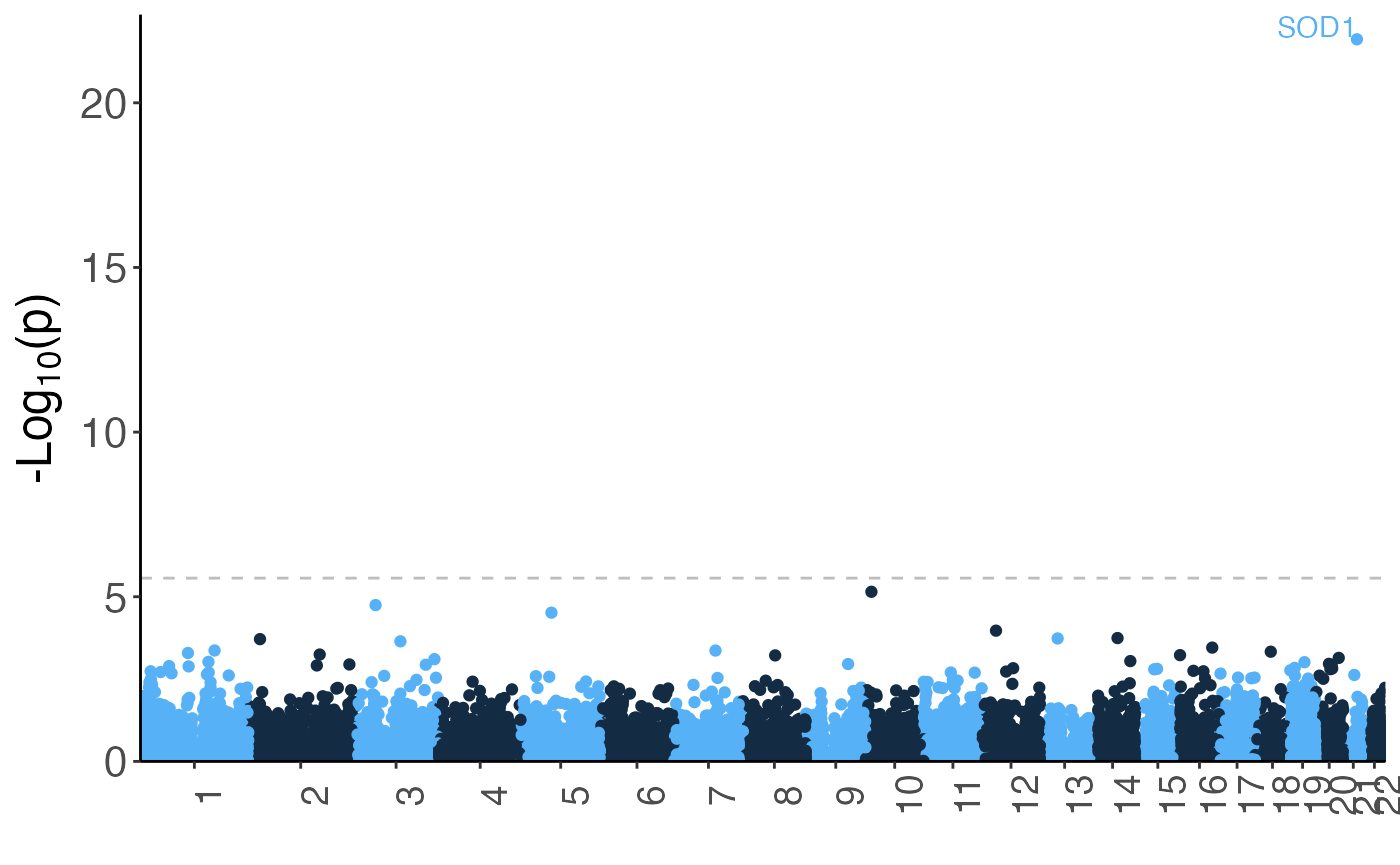
Manhattan
Manhattan plots can be generated using the manhattan()
method. The label parameter can be specified to indicate a
column with labels that should be displayed for significant results:
manhattan(rvbresults[rvbresults$test == "skat_burden_robust" &
                  rvbresults$varSetName == "ModerateImpact",],
          label = "unit",
          contigs = "GRCh38")